I risultati della tomografia sismica dell’Etna ottenuta con la sismicità avvenuta negli ultimi 2 anni mostrano zone di accumulo di magma che possono alimentare l'attività eruttiva.
Attraverso l’applicazione di una tecnica sismologica denominata “Tomografia Sismica 4D” un team di ricercatori dell’Istituto Nazionale di Geofisica e Vulcanologia (INGV) ha definito la struttura dell’Etna, dai crateri sommitali fino a 10-12 km di profondità, scoprendo che al di sotto della parte centrale del vulcano sono presenti tre zone che “rallentano” le onde sismiche determinandone un aumento dei tempi di percorso. Gli scienziati hanno interpretato queste anomalie come zone fratturate ad alta temperatura contenenti una percentuale di magma pari al 4% del volume complessivo, quantità che può alimentare l’attività eruttiva per diverso tempo.
Questi i risultati dello studio Re-pressurized magma at Mt. Etna, Italy, may feed eruptions for years appena pubblicato sulla rivista Communications Earth & Environment e condotto con la sismicità dell’Etna verificatasi tra il gennaio 2019 e il febbraio 2021.
“I processi di formazione del magma e quelli che ne inducono la risalita dalle profondità crostali verso la superficie sono da sempre un argomento di grande interesse scientifico, in quanto utili per la comprensione dei meccanismi che determinano le eruzioni e le evoluzioni dei vulcani”, spiega Pasquale De Gori, ricercatore dell’INGV e primo autore dello studio. “La tecnica della tomografia sismica 4D”, prosegue De Gori, “è utilizzata molto spesso per studiare sia complessi vulcanici che zone tettonicamente attive. All’accadimento di un terremoto, l’energia sismica - sotto forma di onde elastiche - viaggia all’interno della struttura vulcanica e, attraversando volumi di crosta fratturata contenente magma e fluidi magmatici, subisce rallentamenti che ci permettono di definire dove è probabile che il magma sia contenuto. In questo studio abbiamo calcolato la variazione delle velocità delle onde sismiche negli ultimi anni per verificare la presenza di nuovo magma ed eventualmente i volumi in gioco, identificando una zona profonda e piuttosto estesa, posizionata tra 4 e 9 km di profondità, e altre due zone più superficiali e di dimensioni più ridotte, prossime ai crateri sommitali, in cui le onde sismiche sono particolarmente lente”.
L’Etna è un’area molto attiva dal punto di vista sismico. L’Osservatorio Etneo dell’INGV (OE-INGV) effettua il monitoraggio sismico h24 attraverso una rete di sensori che dal 2005 al 2021 ha registrato più di 11.000 terremoti con magnitudo compresa tra 1.0 e 4.8 e con profondità variabili da qualche centinaia di metri al di sotto dei crateri sommitali fino a circa 30 km di profondità nel versante occidentale del vulcano.
“La possibilità di utilizzare un dataset di terremoti molto ampio”, aggiunge il ricercatore, “ci ha consentito di determinare la struttura di velocità delle onde sismiche “P” del vulcano dal2005 al 2019, fornendoci un'immagine media a lungo termine. La struttura ottenuta con il dataset più recente del periodo 2019-2021, invece, ci ha consentito di definire i cambiamenti che si sono verificati negli ultimi anni. Considerando l’attività dell’Etna degli ultimi due decenni, diversi studi concordano sul fatto che la dinamica del vulcano è stata prevalentemente condizionata da processi intrusivi, cioè di risalita del magma, accompagnati da attivazione delle faglie sul fianco Sud-orientale del vulcano e dalla instabilità del fianco orientale, che si manifesta con dei rapidi fenomeni di scivolamento verso il mar Ionio. Questi due processi sono fortemente connessi in quanto l’intrusione innesca lo scivolamento del fianco orientale che, a sua volta, può favorire le eruzioni stesse depressurizzando i condotti vulcanici centrali”.
“Dallo studio”, conclude il ricercatore, “è emerso che la zona profonda in cui le onde sismiche sono lente si trova sull’estremità di una zona caratterizzata, invece, da un’alta velocità delle onde, che rappresenta la parte di magma non eruttata e consolidata e che costituisce la traccia della vecchia attività dell’Etna nel corso della sua evoluzione geologica. Con questo studio ipotizziamo che il magma proveniente dalle parti più profonde della crosta giunga in questa prima zona di accumulo e che il nuovo magma crei una pressurizzazione del sistema innescando gran parte della sismicità che si osserva all’Etna tra 4 e 12 km di profondità. Da queste profondità assistiamo a risalite magmatiche nelle zone di accumulo più superficiali, testimoniate dall’incremento della sismicità, che possono alimentare fasi eruttive come è accaduto negli ultimi mesi”.
Link:
---
Seismic tomography defines the internal structure Mt Etna volcano revealing volumes of magma accumulation at shallow depths
The results of the seismic tomography carried out at Mt Etna by using the seismicity occurred in the last 2 years show volumes of magma accumulation that could feed the eruptive activity.
Through the application of a seismological technique called "4D Seismic Tomography" a team of researchers from Istituto Nazionale di Geofisica e Vulcanologia (INGV) studied the crustal structure of Mt. Etna, from the summit craters down to 10-12 km depth. Tomographic results revealed three volumes where seismic velocity is reduced, located in the central part of the volcano. These features are interpreted as volumes of high temperature fractured rocks where magma accumulated in the uppermost volcanic structure. From velocity reduction, scientists have estimated that these rock volumes contain a magma fraction of about 4 % which could feed eruptions for years in the future.
These are the main results of the study Re-pressurized magma at Mt. Etna, Italy, may feed eruptions for years just published in Communications Earth & Environment magazine. The research was conducted by using the Mt. Etna seismicity that occurred between January 2019 and February 2021.
" The study of mechanisms of magma formation and migration from the deep crust up to the surface is of great interest, to better understand the eruptive processes and the evolutions of volcanoes", explains Pasquale De Gori, INGV researcher and first author of the study. “The 4D seismic tomography”, continues De Gori, “is a technique widely used to study both volcanic complexes and tectonically active regions. Seismic waves radiated by an earthquake travel inside the volcanic structure and, crossing a fractured rock mass containing magma and magmatic fluids, are slowed down and recorded later at the seismic stations. Seismic tomography defines the geometrical extexts of such volumes of low velocity where the magma is likely to be contained. In this study we calculated the variation over time of seismic P-waves velocity in order to verify if, in the last few years, new magma has been emplaced in the shallow volcanic structure, and possibly the volumes involved. We identified 3 regions of low P-waves velocity that we interpreted as volumes where magma accumulated. The deepest and the largest region is located between 4 and 9 km depth. In addition, two smaller regions are found at shallower depths, close to the summit craters".
Mt. Etna is characterized by a diffuse seismicity. The INGV Osservatorio Etneo (OE-INGV) carries out 24h seismic monitoring through a network consisting of 30 seismic stations. From 2005 to 2021 more than 11,000 earthquakes have been recorded, with magnitudes between 1.0 and 4.8 and with depths ranging from a few hundred meters below the summit craters down to 30 km depth on the western side of the volcano.
“A large seismic dataset,” adds the researcher, “allowed us to determine the P-wave velocity structure of the volcano from 2005 to 2019, providing us with a long-term average image of the volcanic structure. Furthermore, the tomographic model obtained with the most recent dataset (2019-2021) allowed us to define the velocity variations that occurred in recent years. Following the most recent literature, in the last two decades the Mt. Etna dynamics has been mainly controlled by intrusive processes, i.e. magma rising, by the activation of the faults on the south-eastern flank of the volcano and by the instability of the eastern flank, with rapid sliding episodes. These processes are strictly connected since intrusion triggers the sliding of the eastern flank which, in turn, can favor the eruptions by depressurizing the central volcanic conduits".
"The study shows", concludes the researcher, "that the deepest volume where seismic waves are slowed down is located on the edge of a volume characterized by high P-waves velocities, which represents the part of magma not erupted and now consolidated. It is the trace of the old activity of Etna during its geological evolution.
In this study we hypothesize that the magma coming from the deepest parts of the crust reaches the deepest region of low P-wave velocity. In this volume, the new magma creates a pressurization of the system, triggering most of the seismicity observed at Mt. Etna is between 4 and 12 km depth. Magma rises from the deepest to the shallower low Vp volumes as documented by the increase of shallow seismicity, possibly feeding eruptive episodes, as happened in recent months”.
Link:

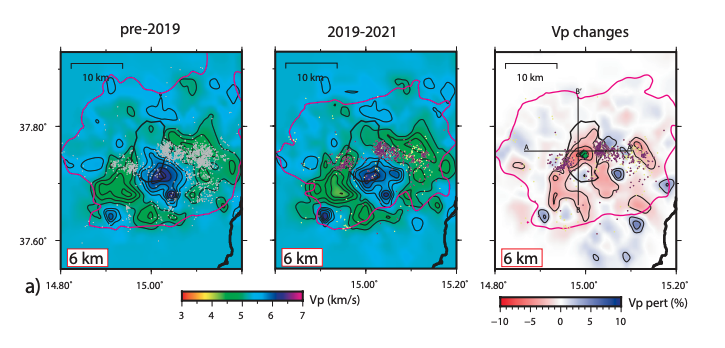
Fig. a - Distribuzione della velocità delle onde sismiche P alla profondità di 6 km nel periodo 2005-2019 e nel periodo 2019-2021. Si riportano inoltre i cambiamenti di velocità tra i due periodi. Il modello di background è quello 2005-2019 che rappresenta un’immagine “time independent” del vulcano.
Fig. a - Distribution of P-waves velocity at 6 km depth in the period 2005-2019 and in the period 2019-2021. Velocity changes between the two periods are also reported. The background model is the 2005-2019 one which represents a “time independent” image of the volcano.

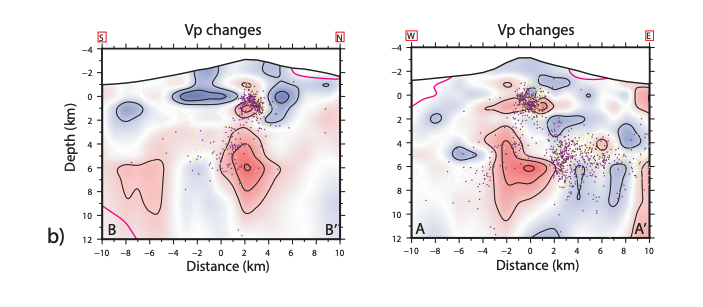
Fig. b - Sezioni verticali S-N e W-E che mostrano la distribuzione delle differenze di velocità in profondità. La sismicità viene rappresentata con i puntini colorati in base al tempo di accadimento degli eventi sismici (grigio=pre 2019, giallo 2019-2020, viola 2020-2021).
Fig b - S-N and W-E vertical sections showing P-waves velocity changes over depth. Seismicity is represented with dots color-coded for time of occurrence of seismic events (gray = pre 2019, yellow = 2019-2020, purple = 2020-2021).

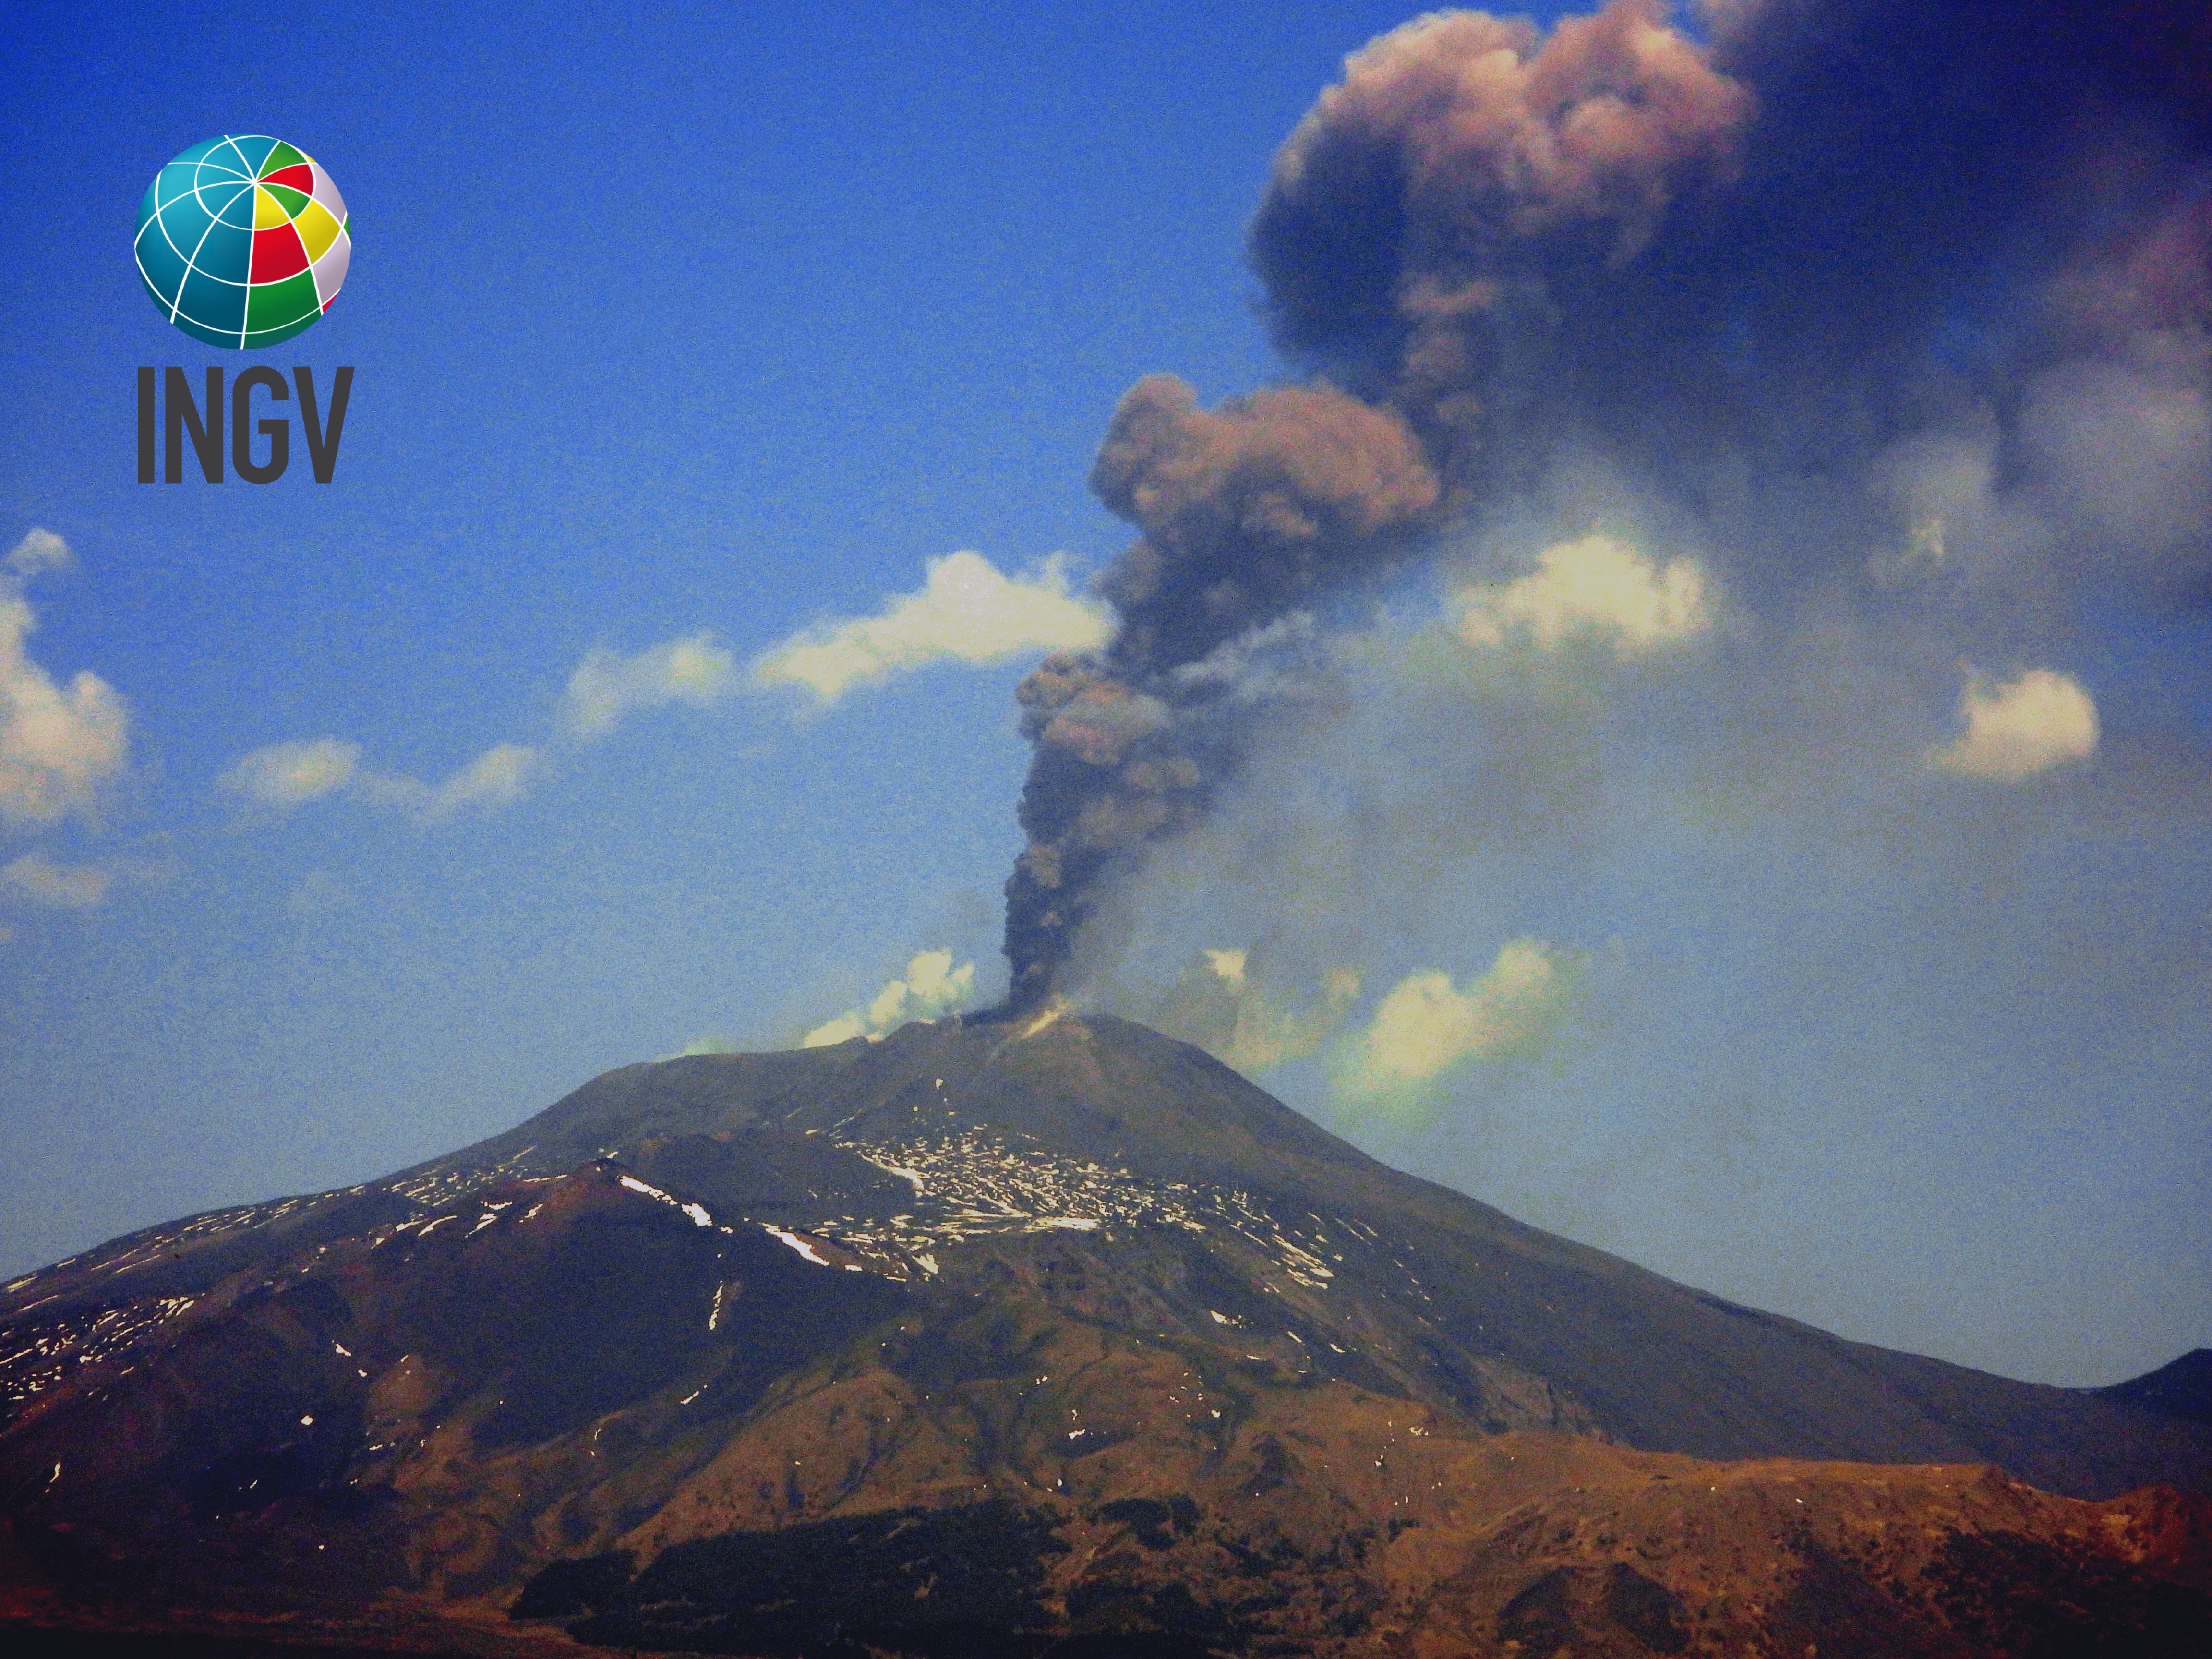
Foto – Il vulcano Etna.
Photo - Mt Etna.


